Overview:
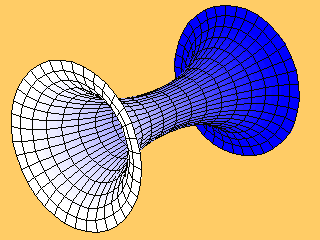
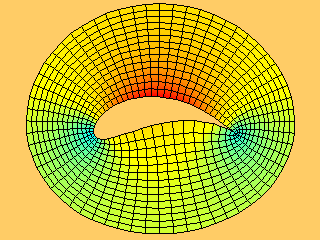
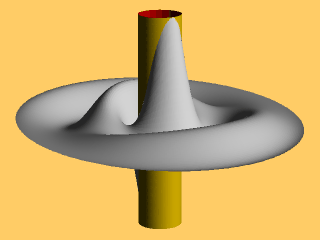
Pixmax is a simple plot utility for 3d data-sets. It was written to generate images which are later combined to FLI-animations. The program is batch-oriented and produces raster images as output. Vector plots are not possible! The program reads commands from a file or standard input. When end of data is reached it writes a PPM-file as output. The program can read data sets in so called 'mesh' and 'obj' format. The 'mesh' format is compatible with one of the gnuplot data formats. The 'obj' format is an extension (modification) of the OFF-file format used for unstructured 3d-grids.History:
The pixmax program originated from a collection of separate plot utilities which were used in connection with computational fluid dynamics applications. The used numerical method worked with unstructured grids consisting of triangles. Mainly time dependent processes were investigated. To visualize the results animations were produced, which showed the unsteady distribution of some flow quantities like pressure or vorticity.At that time many plot libraries had no or only a very limited support of unstructured grids. Some hat problems with the number of triangles which could be up to 100,000. Because of that, little self-made utilities were written (many in Fortran!). The time went on and the collection of these utilities grew. The FLI-format was chosen as animation standard. Thus, the programs were all able to generate some kind of bitmap output. To unify the hole plotting, the collection of utilities was combined in one program -- the first version of pixmax.
There was no public release of the program, mainly because of a missing documentation. Recently the program was reworked and an acceptable documentation was assembled. Thus, the current version could be released to public.
More information, documentation and examples:
Files:
- pixmax-2.2.src.tar.gz (source, fonts, man page, no examples, 40kB)
- pixmax-2.2-1.i386.rpm (binary, no source, no examples, RPM build under SUSE-Linux ver. 7.3, 42kB)
- pixmax-2.2-1.spec (spec file used to build RPM)
- pixmax-2.2.doc.tar.gz (documentation, example images, data sets, scripts, 654kB)
- pixmax-2.1.tar.gz (source, documentation and example images; 678kB)
- pixmax-2.1-1.i386.rpm (binary, documentation and example images - no source; RPM build under SUSE-Linux ver. 7.3; 682kB)
- pixmax-2.1-1.spec (spec file used to build RPM)
- README


