Bluff-Body Flow (..continued)
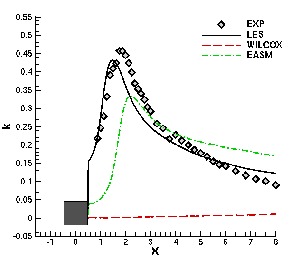
Fig. 4 depicts the reason for the poor performance of the Wilcox model.
In contrast to the EASM and LES the Wilcox model predicts almost no kinetic energy at the wake centerline.
The EASM produces much more kinetic energy, again the LES is closer to the experimental data.
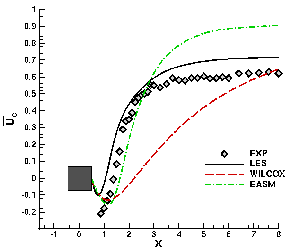
Comparing the velocity at the centerline in fig. 5, the EASM and the LES show the same error in the recirculation length, but then the EASM recovers faster and overpredicts the velocity downstream.
The Wilcox model overpredicts the recirculation zone by a factor of two, with a poor recovery.

|

|
|
Fig. 4 centerline total kinetic energy
|
Fig. 5 centerline u-velocity
|
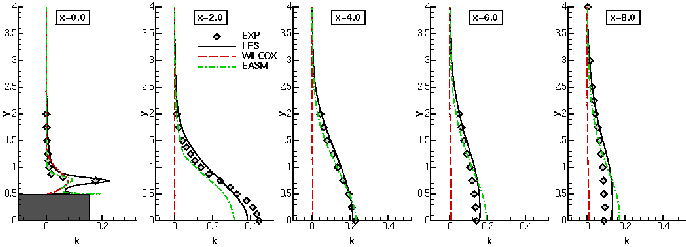
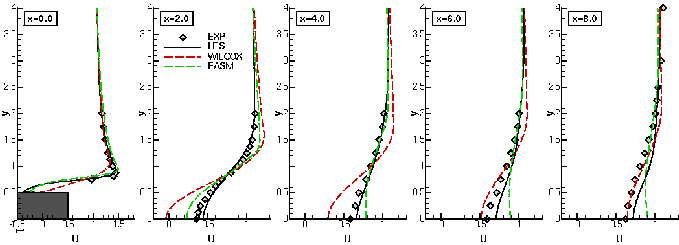
Fig. 6 and 7 show the kinetic energy and u-velocity in the wake region. Again the standard model performs poor showing no kinetic energy or recovery. The LES is in good agreement with the experiment and the EASM can predict the correct flow behaviour, but overpredicts the velocity.

Fig. 6 total kinetic energy in the wake region

Fig. 7 u-velocity in the wake region
Webmaster
Last modified: Fri Dec 17 10:41:32 CET 1999


