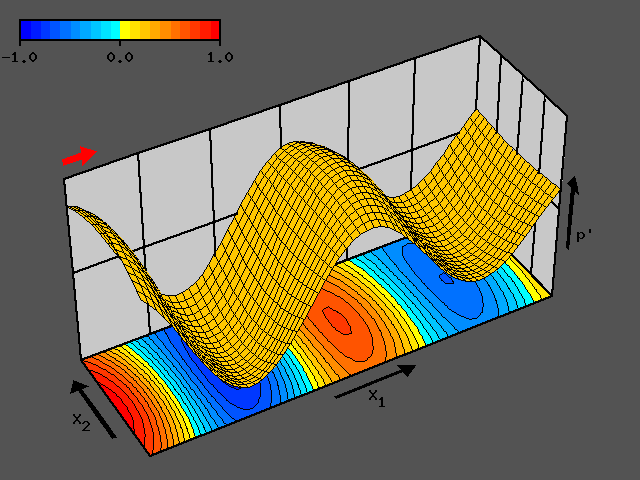
Wave example
Drawing 3d-surface plus projected contour plot below

Commands:
back 83,83,83
set box 6,2,3.0

set view -30,40
set zoom 1.7

# side walls

set line_dz 0.01
set line_w 1
set line_color 0,0,0
set face_color 200,200,200

draw xz_grid 1.0 6,2
draw yz_grid 1.0 4,2
set grid_face no
set line_dz 0.04
draw xy_grid -1.0 1,1

set line_dz 0.02

# surface plot

set xrange 0,3.001
set yrange -0.501,0.501
set zrange -1,1

set face_color 255,200,0
set edge_color 0,0,0

set edge_w 0
set app fe

draw mesh RES.MESH

# contour plot at bottom

set line_w 0
set cont -1.0,0.1,1.0
set lut color.lut
set using 3

set appearance fsc
set coord 1,2,0
set zrange 0,1
draw mesh RES.MESH

# black arrows

set xrange -3,3
set yrange -1,1
set zrange -1.5,1.5

set appearance f
set face_color 0,0,0
set coord 1,2,3

draw obj ARROW.OFF

# labels

set font 9x15bold
set text_bg 83,83,83
set text_fg 0,0,0
set center cc
3dtext [1.0,-1.6,0.0]  p'
set center rc
3dtext [0.0,-1.5,-1.0]   X
set center lt
3dtext [0.0,-1.5,-1.0]   1
set center rc
3dtext [-1.15,0.0,-1.0]   X
set center lt
3dtext [-1.15,0.0,-1.0]   2

# red arrow

set appearance f
set face_color 255,0,0
set hidden_color 255,0,0

draw obj ra_plus.off

# colorbar

set line_w 1
set cb_ticks 3
draw color -1,1
Files:
- Shell script: pix6.run
- Data set 1: RES.MESH (Surface)
- Data set 2: ARROW.OFF (black arrows)
- Data set 3: ra_plus.off (red arrow)
- LUT-file: color.lut
back
